Billions of euros are flowing into electric vehicle infrastructure. Yet, the basic math used to predict where chargers should go and how much energy they will dispense is rarely checked against reality once the concrete dries.
For an industry dependent on heavy capital expenditure, this blind spot is dangerous. When a site underperforms, asset managers panic. When it overperforms, capacity is squeezed.
The Risk of the Single Site
Looking at one specific site will always involve some unpredictability. Roadworks or local fleet changes will always cause daily fluctuations. When executives look at single-site performance in a vacuum, they see this volatility and freeze. But the data shows that agonizing over individual plots is the wrong approach entirely.
Reducing Risk by Building a Network
Every business leader knows that diversification reduces risk. But the real question for EV infrastructure is: exactly how many sites do you need to build before your revenue projections become predictable?
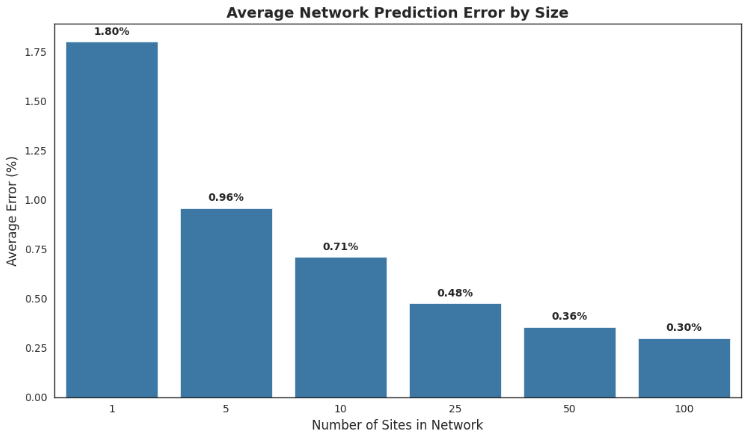
To find out, we ran thousands of simulations against live operational data, grouping our sites into random portfolios. The answer is surprisingly low. The drop in daily volatility is severe:
- 1-Site Node: 1.80% average error
- 5-Site Network: 0.96% average error
- 10-Site Network: 0.71% average error
- 25-Site Network: 0.48% average error
- 50-Site Network: 0.36% average error
- 100-Site Network: 0.30% average error
Why a Fraction of a Percent Matters?
A 1.80% sounds like a rounding error. Why should we care if it drops to 0.36% for a 50-site network? Because we are measuring utilization of massive hardware capacity.
Imagine a standard site equipped with two 100 kW chargers. By benchmarking against realistic average power (50 kW per connector), its daily capacity is 2,400 kWh per day. A 1% error in utilization equals 24 kWh a day, or over 8,700 kWh per year.
If your single-site forecast is off by 1.80%, that is thousands of euros in unexpected revenue swings for that one location. But when you scale to a portfolio of 50 sites, error shrinks to just 0.36% (a swing of only about 8 kWh a day per site). The financial variance practically disappears, making your revenue projections highly stable.
Consistency Across The Board
A common counter-argument is that this aggregation only works if a portfolio is loaded with high-throughput sites masking the failures of quieter ones.
The data proves otherwise.
We segmented the operational sites into five utilization brackets, ranging from the quietest destination chargers (1.0 % - 2.7 % utilization) to the most active transit hubs (6.3 % - 19.0 % utilization)
The scaling effect holds true across every tier. For the highest-volume sites, grouping 50 locations tightens the aggregate error to a minuscule fraction of a percent.
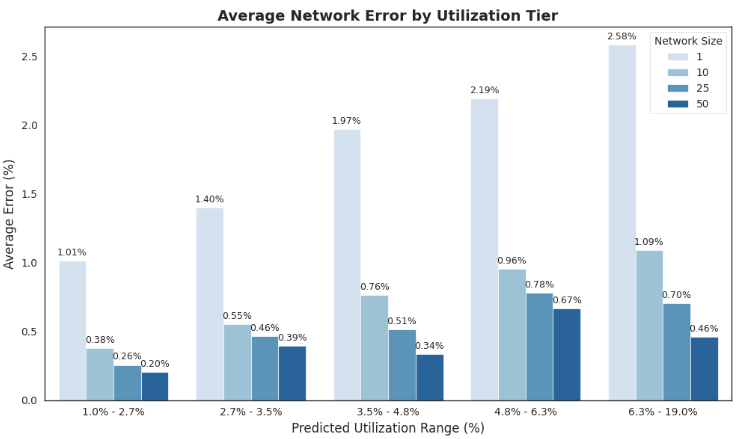
Crucially, for lower-volume destination sites, a 50-site network provides the exact same stabilizing effect. The principle works regardless of the specific network strategy.
The Commercial Takeaway
It’s simple: stop agonizing over the day-to-day volatility of single locations, as that variance is unavoidable. Instead, focus on scaling the network. When you build a portfolio of 25 or more locations, individual site risks fade away, leaving you with highly predictable returns.
